


Jason
November 8, 2026
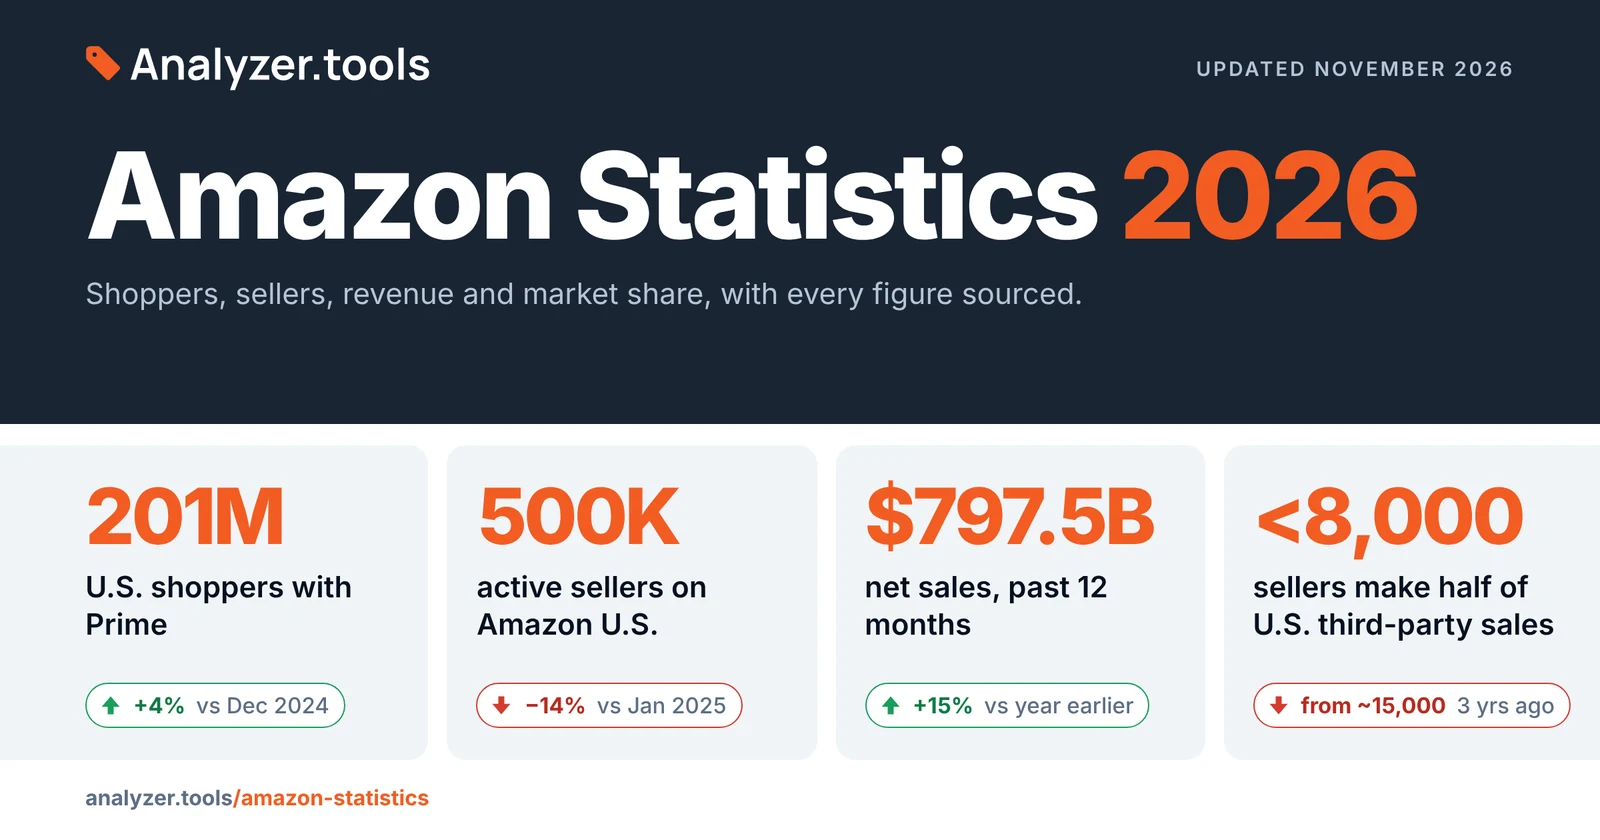
Amazon booked $797.5 billion in net sales over the 12 months ended September 30, 2026, up 15%, and third-party sellers accounted for 61% of its paid units worldwide in the latest quarter. If you sell on Amazon, or plan to, those numbers shape what you can win.
This page answers the questions sellers and researchers actually search: how many people shop on Amazon, how many products it sells, how many sellers there are, what Amazon keeps from them, and how big it is in U.S. e-commerce. Every figure links to its source, and each is marked as reported (published by Amazon or a government agency) or an estimate (an analyst's or survey's own figure). Where Amazon does not publish a number, we say so rather than guess.
Last updated: November 7, 2026. We refresh this page after each Amazon earnings release.
Amazon Quick Stats (2026)
- How many people shop on Amazon? About 201 million individuals in the U.S. were Prime shoppers as of December 2025 (CIRP estimate). Amazon does not publish a current worldwide count; its last was 200 million+ Prime members in April 2021.
- How much revenue does Amazon generate? $797.5 billion over the 12 months to September 30, 2026, up 15% (reported). Full-year 2025 was $716.9 billion, up 12%.
- How many products does Amazon sell? Amazon does not publish a catalog size. The figure most often cited is about 600 million listings (Capital One Shopping estimate).
- How many sellers are on Amazon? About 500,000 active sellers on Amazon U.S. (March 2026) and under 1.56 million worldwide, down 16% in a year (May 2026), per Marketplace Pulse estimates.
- How much of Amazon is third-party sellers? 61% of paid units in Q3 2026 (reported); roughly 69% of sales value (estimate).
- How much does Amazon earn from seller fees and ads? $66.1 billion in Q3 2026 from third-party seller services and advertising combined, about a third of net sales (reported lines, our sum). That is 96.6% of Amazon's online-store sales, up from 89.3% a year earlier (Marketplace Pulse).
- How big is Amazon in U.S. e-commerce? About 35.7% in 2025 (Marketplace Pulse estimate), and 9.6% of all U.S. retail spending in Q2 2026 (PYMNTS Intelligence).
- How many orders does Amazon get a day? Amazon does not disclose order counts. Reported delivery volumes are below.
For the data behind your own product decisions, see every data point stage.analyzer.tools returns.
How we sourced these numbers
Reported figures come from Amazon's own earnings releases, shareholder letter and seller report, or from U.S. government data. Estimates come from named analysts and survey firms, each with its own definitions: Marketplace Pulse (seller counts and sales value), CIRP (Prime shoppers), Seller Assistant (listing-level wholesale data), Numerator (shopper demographics), PYMNTS Intelligence (share of retail spending) and Capital One Shopping (catalog size). Revenue-by-line totals for 2025 are the sum of Amazon's four quarterly releases. Where two sources use different scopes (for example active sellers on Amazon U.S. versus worldwide), we state the scope each time and never mix them.
We left out figures we could not trace to a named source, including daily order counts and share-of-household Prime estimates that appeared on earlier versions of this page.
Amazon Statistics, Grouped by the Questions Sellers Ask:
1. How Many People Shop on Amazon?
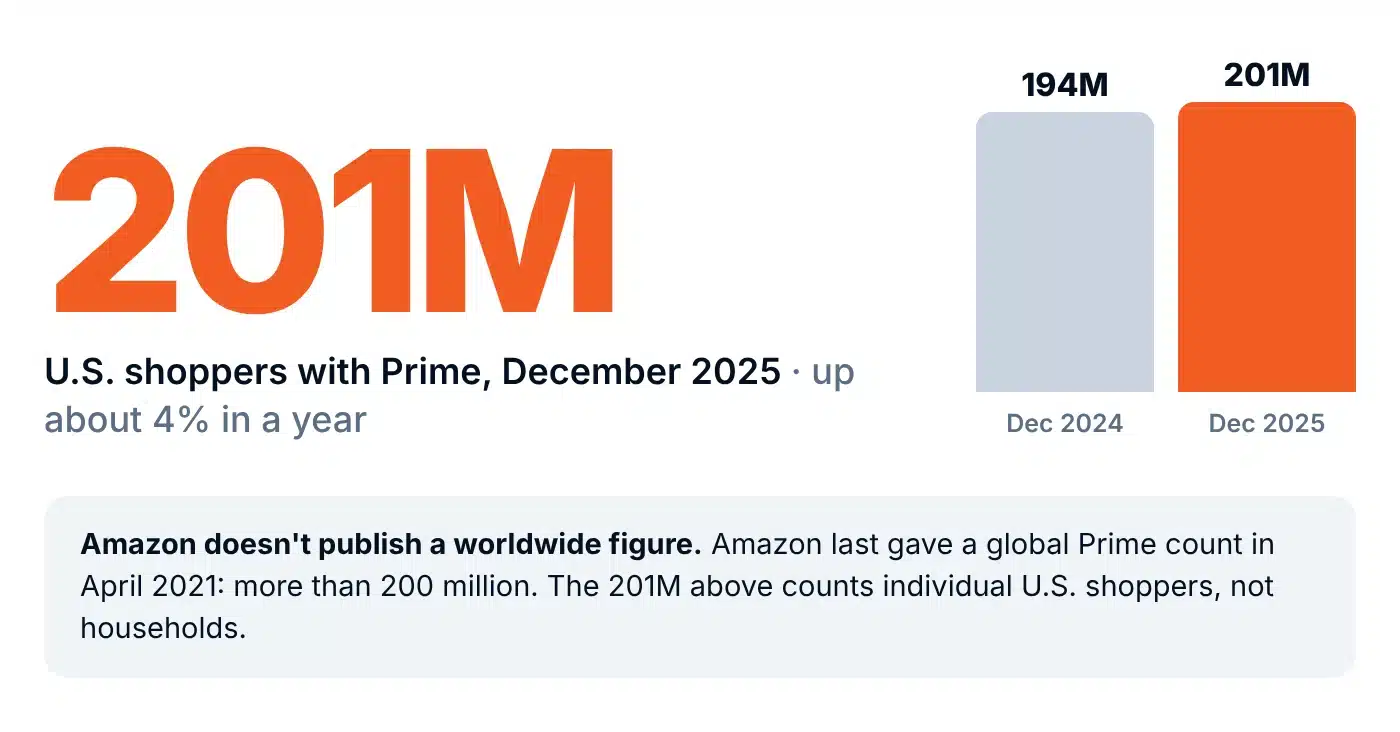
About 201 million individual U.S. shoppers had Amazon Prime as of the December 2025 quarter, up roughly 4% from 194 million a year earlier, according to CIRP, Jan 20, 2026. CIRP counts individuals, not households, so the figure includes people who share a Prime membership. It is a survey-based estimate.
Amazon does not publish a current worldwide count of customers or Prime members. Its last global figure was more than 200 million Prime members, stated in its April 2021 shareholder letter. Any "300 million+ customers" figure you see on other sites is a third-party estimate, not an Amazon figure.
- Prime Day 2026 (June 23-26): shoppers spent $26.4 billion online in the U.S. across all retailers, up 9.3% from the prior year, and 54.2% of that spend came from mobile devices. Adobe, Jun 29, 2026 (this measures every retailer in the event, not Amazon alone).
- Same-day delivery: nearly 100 million customers used Amazon Same-Day Delivery in 2025, and U.S. same-day items rose nearly 70% (Amazon Q4 2025 results).
To turn that audience into a product decision, read How to Find a Product to Sell on Amazon Without Guesswork.
2. How Many Products Does Amazon Sell?
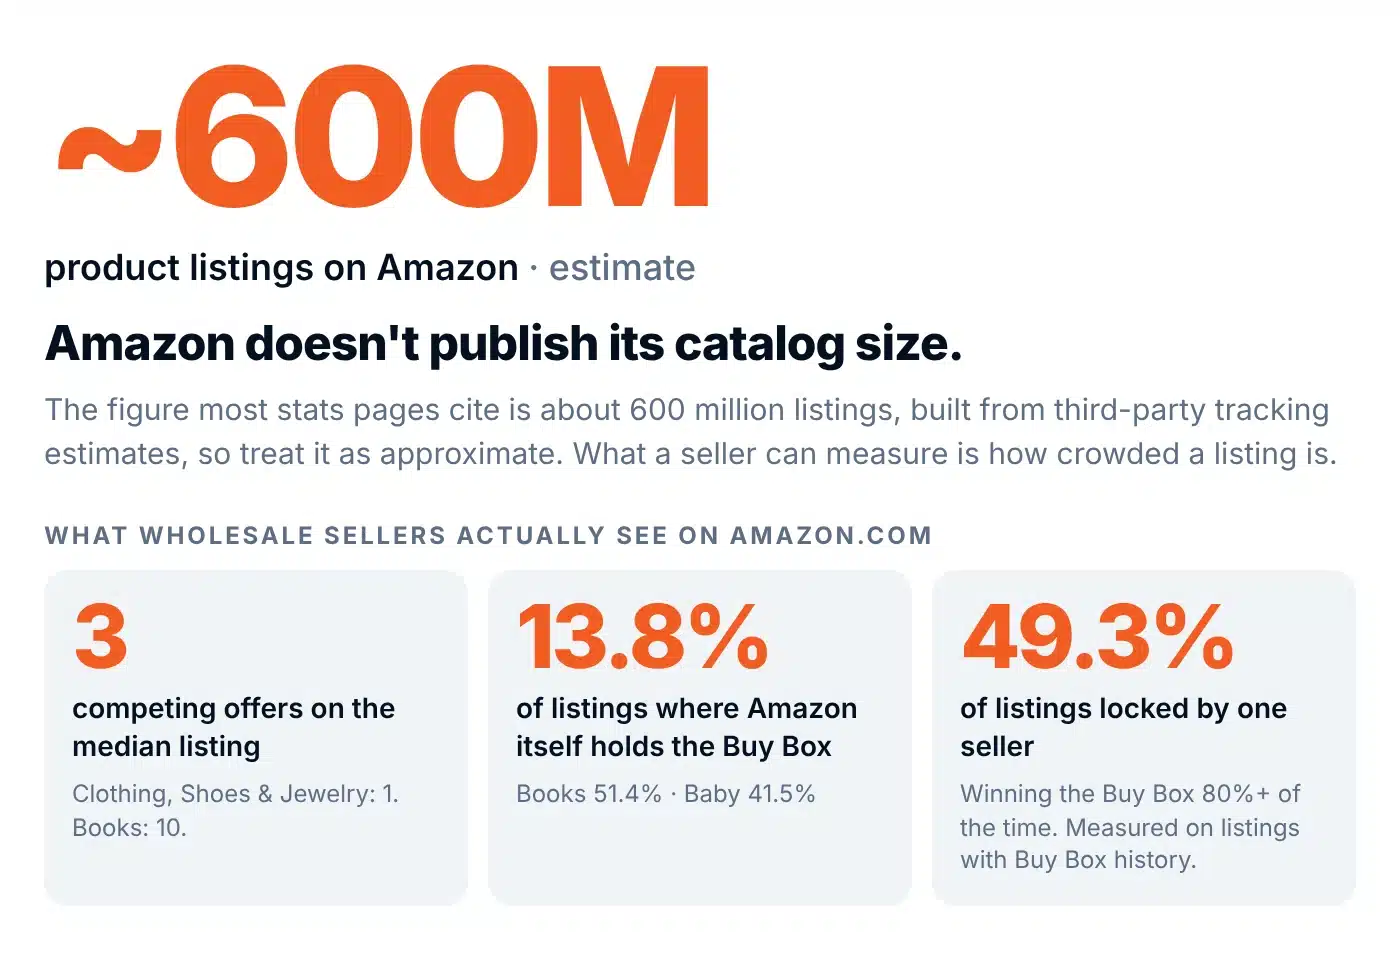
Amazon does not publish the size of its catalog. The number most often cited is about 600 million product listings, from Capital One Shopping (June 2026). That figure is compiled from third-party tracking estimates, so treat it as approximate. Earlier versions of this page cited "350 to 600 million"; we now use a single estimate and label it as one.
What a seller can measure is how crowded a listing is. Seller Assistant, State of Amazon Wholesale Q3 2026 analyzed 14.2 million Amazon.com listings built from 782 wholesale sellers' supplier lists (July 2025 to August 2026). This is a software vendor's sample of wholesale sellers, not all of Amazon, so read it as an estimate for wholesale:
- Competition per listing: the median listing has 3 competing offers. Clothing, Shoes & Jewelry has a median of 1; Books has 10.
- Amazon as a seller: Amazon itself holds the Buy Box on 13.8% of analyzed listings, and on more than half of scans for 22.1% of repeat products. Its presence is highest in Books (51.4%) and Baby (41.5%).
- Locked listings: 49.3% of the listings with Buy Box history are "locked" (one seller wins the Buy Box 80% of the time or more). Pet Supplies is the most locked category at 62.4%; Grocery is the most open large category at 38.1%.
- Turnover: 63.2% of the 964,614 products scanned in 2026 were not in the 2025 scans.
More on picking niches: Discovering Profitable Amazon FBA Niche Ideas (and Avoiding Duds).
3. How Many Sellers Are on Amazon, and Can New Ones Win?
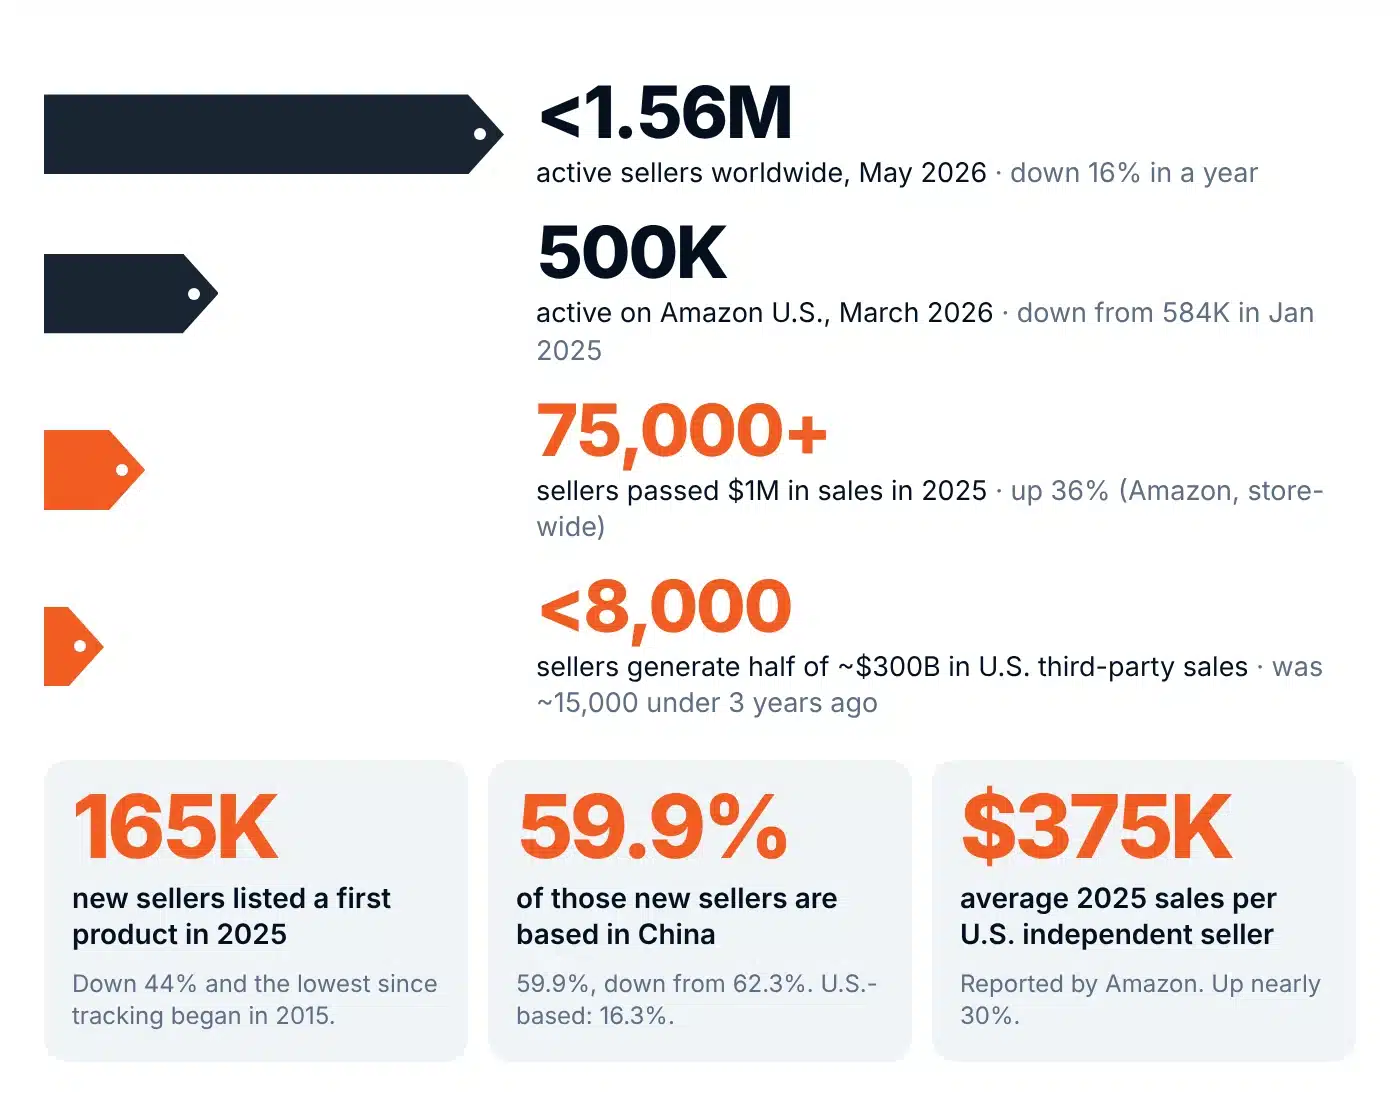
Seller counts depend on scope, so we state it every time. Marketplace Pulse estimates under 1.56 million active sellers worldwide, down 16% in a year (Marketplace Pulse, May 14, 2026). It counts a seller as active if it received at least one feedback in the past year. Its earlier estimate was 1.65 million at the end of 2025 (Jan 15, 2026). For Amazon U.S. alone it counts 500,000 active sellers in March 2026, down from 584,000 in January 2025 (Marketplace Pulse, Apr 16, 2026). Marketplace Pulse does not state its definition of "active" for the U.S. count.
- New sellers: about 165,000 sellers listed a first product on Amazon.com in 2025, down 44% from 2024 and the lowest since tracking began in 2015. These count sellers who listed at least one product, not dormant sign-ups. Chinese sellers were 59.9% of new launches (62.3% in 2024) and U.S. sellers 16.3% (Marketplace Pulse, Jan 15, 2026).
- Concentration: fewer than 8,000 sellers generate half of an estimated $300 billion in U.S. third-party sales value, down from about 15,000 less than three years earlier (Marketplace Pulse, Apr 16, 2026).
- The top end (reported by Amazon): more than 75,000 independent sellers passed $1 million in sales in 2025, up 36%. Average sales per U.S. independent seller were more than $375,000, up nearly 30%, and more than 11,000 U.S. sellers grew sales over 10x (Amazon 2025 Small Business Empowerment Report).
Fewer sellers and more concentration make product selection the decision that matters most. See Amazon Product Research: What It Is and Why It Matters, or Top Free Amazon Product Research Tools for Budget-Conscious Sellers if you are on a tighter budget.
4. How Much Does Amazon Make, and What Does It Keep From Sellers?
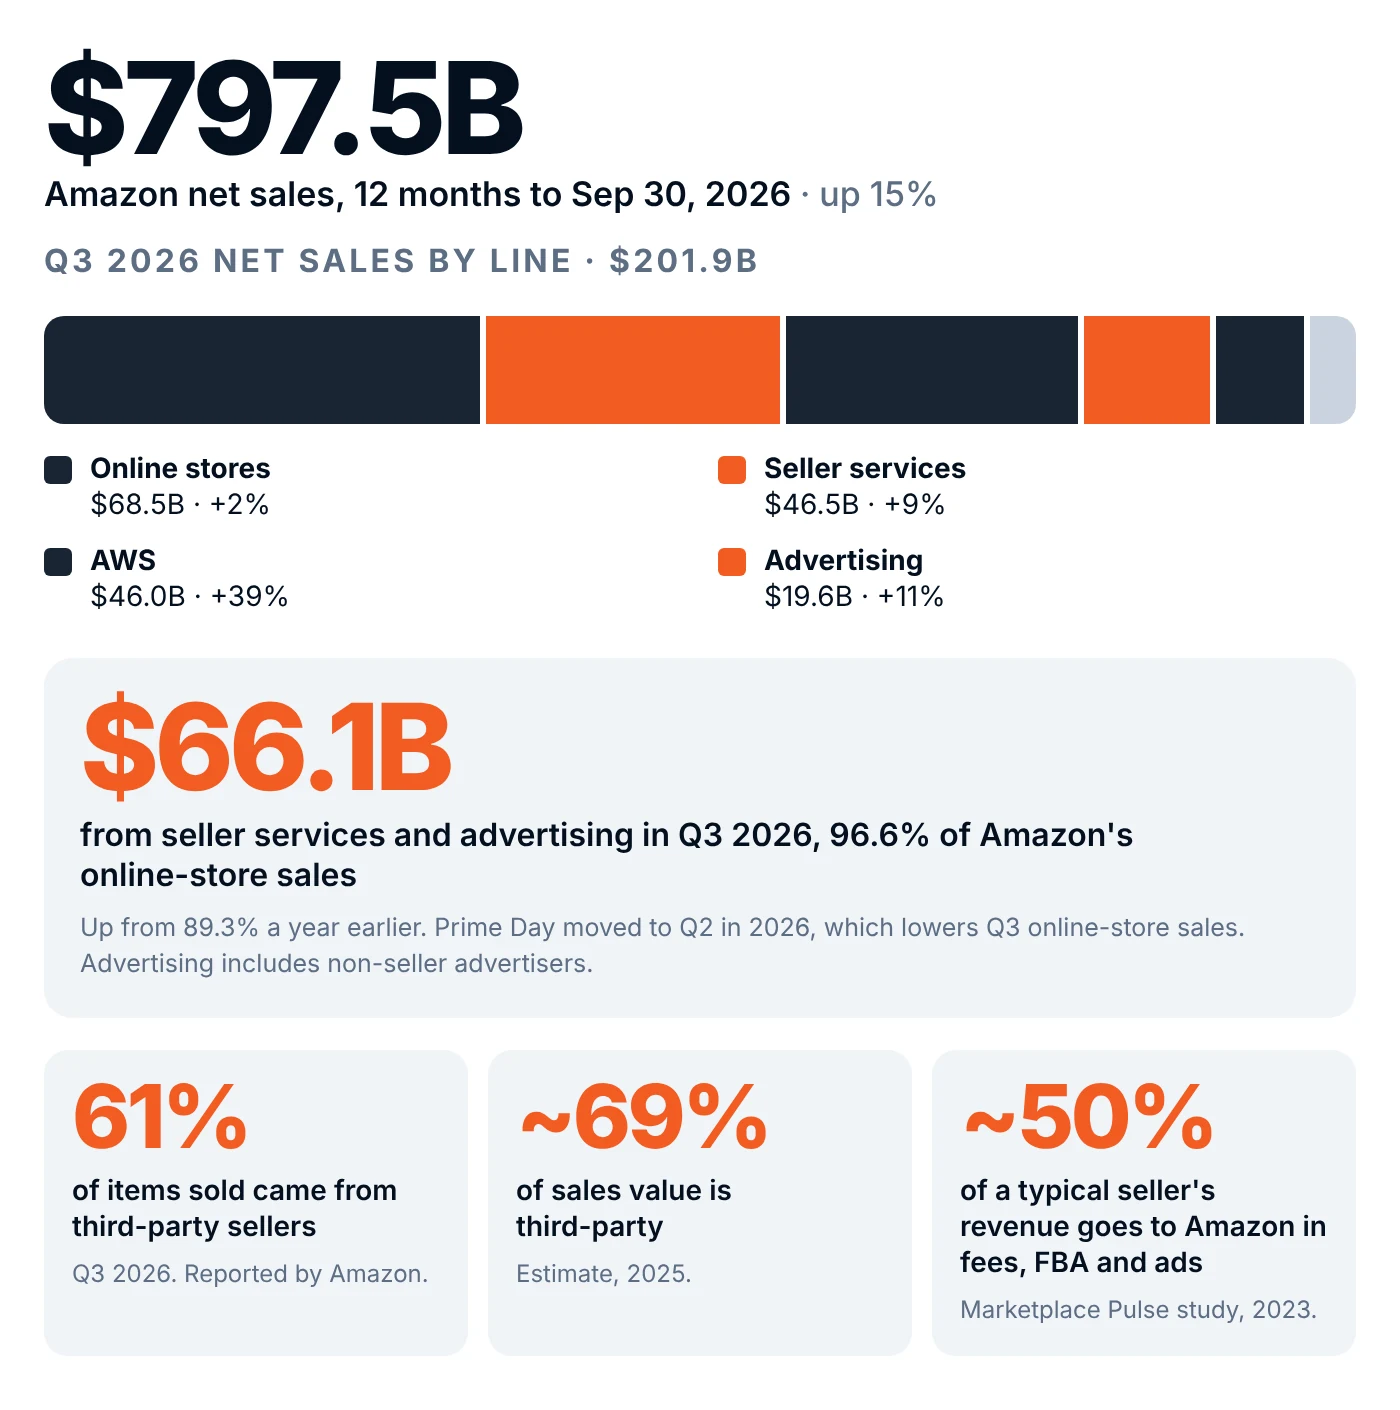
Over the 12 months ended September 30, 2026, Amazon reported $797.5 billion in net sales, up 15% from $691.3 billion a year earlier. Third-quarter net sales were $201.9 billion, up 12% (Amazon Q3 2026 results). Full-year 2025 was $716.9 billion, up 12% from $638.0 billion (Amazon Q4 2025 results). The table shows revenue by line, in billions of dollars. Prime Day fell in Q3 in 2025 but mostly in Q2 in 2026, which holds down Q3 retail growth; Amazon says growth would have been about 4 points higher without that shift.
| Revenue line | Q3 2025 | Q3 2026 | Q3 growth | Full-year 2025 |
|---|---|---|---|---|
| Online stores | $67.4B | $68.5B | +2% | $269.3B |
| Third-party seller services | $42.5B | $46.5B | +9% | $172.2B |
| AWS | $33.0B | $46.0B | +39% | $128.7B |
| Advertising | $17.7B | $19.6B | +11% | $68.6B |
| Subscriptions (Prime and others) | $12.6B | $14.0B | +11% | $49.6B |
| Physical stores | $5.6B | $5.7B | +2% | $22.6B |
| Other | $1.4B | $1.6B | +16% | $5.9B |
| Total net sales | $180.2B | $201.9B | +12% | $716.9B |
Sources: Amazon Q3 2026 results for the quarterly columns and growth rates, as Amazon states them. Full-year 2025 line items are the sum of Amazon's four quarterly releases for 2025.
- What Amazon earns from sellers: third-party seller services ($46.5 billion) plus advertising ($19.6 billion) came to $66.1 billion in Q3 2026, about one third of net sales. Advertising also includes non-seller advertisers, so not all of it comes from sellers. For full-year 2025 the same two lines were $240.8 billion.
- Fees and ads versus Amazon's retail sales: in Q3 2026, seller fees plus advertising were about 96.6% of Amazon's online-store (first-party) sales, up from 89.3% a year earlier. Across Q2 and Q3 combined, the gap between the two narrowed from $12.7 billion to $6.2 billion. Prime Day moved mostly into Q2 in 2026, which lowers Q3 online-store sales and raises the ratio (Marketplace Pulse, Nov 5, 2026).
- Third-party share of units: third-party sellers accounted for 61% of paid units in Q3 2026, against 62% in Q3 2025, and 61% to 62% in every quarter of 2025 (reported, Amazon Q3 2026 results). By sales value, Marketplace Pulse estimates the share is roughly 69% (Marketplace Pulse, Apr 16, 2026).
- Take rate (older study): a 2023 Marketplace Pulse study estimated Amazon takes about half of a typical seller's revenue through referral fees, FBA fees and advertising. It is from 2023, so use it as a rough guide, and check your own numbers with the free FBA fee and profit calculator below.
Check one product's fees and margin with the free FBA fee and profit calculator.
Averages only go so far, because fees, competition and demand differ by product. stage.analyzer.tools shows profit, ROI and Bought in Past Month for each product on a supplier list, thousands at a time. View plans and pricing. Plans start at $15.
5. How Big Is Amazon in U.S. E-Commerce?
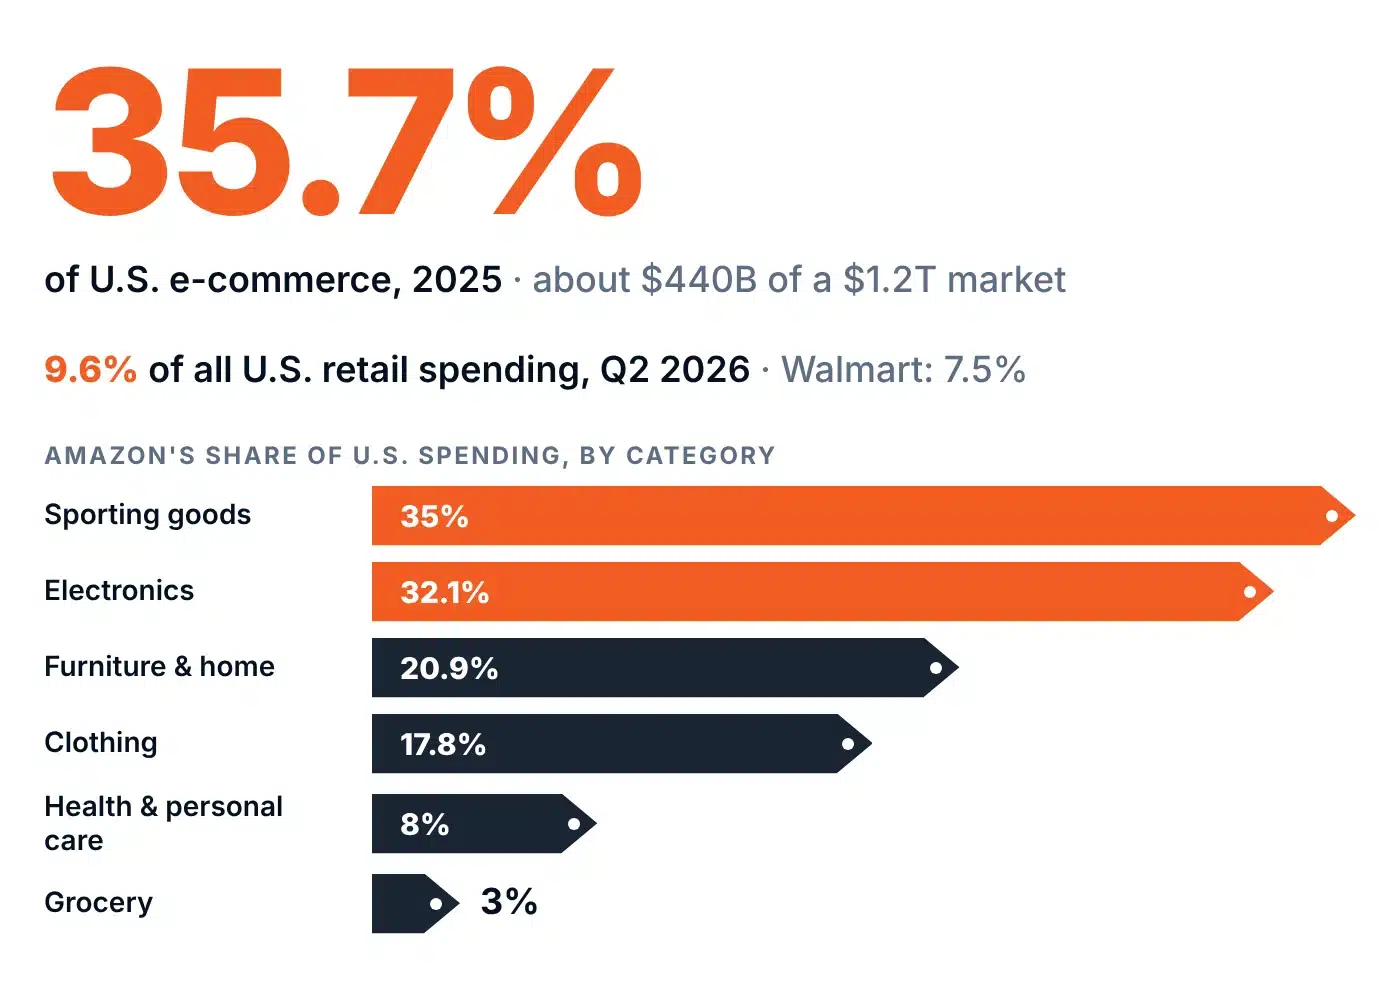
Marketplace Pulse estimates Amazon's sales at roughly $440 billion of a $1.2 trillion U.S. e-commerce market in 2025, a 35.7% share (Marketplace Pulse, Feb 19, 2026). That estimate covers both its own retail and its marketplace. Shopify separately claims 14% of U.S. e-commerce, which together puts the two near half of the market.
Across all U.S. retail, not just online, Amazon took 9.6% of consumer retail spending in Q2 2026, its highest share yet, against 7.5% for Walmart, per PYMNTS Intelligence via Talk Business, Sep 18, 2026. Its share by category: sporting goods 35%, electronics 32.1%, furniture and home 20.9%, clothing 17.8%, health and personal care 8% and grocery 3% (grocery as of June). The study draws on earnings reports and Census Bureau and Bureau of Economic Analysis data.
For context, total U.S. e-commerce was $340.2 billion in Q2 2026, or 17.1% of all retail sales, up 12.2% from a year earlier (U.S. Census Bureau, preliminary, released August 18, 2026).
Where Amazon is strongest (sporting goods, electronics, furniture) is also where its own offers are most likely to compete with yours. Compare categories with What Is Amazon Market Research, and Why Does It Matter for FBA Success?.
6. Who Shops on Amazon?
Public demographic data on Amazon shoppers is thin and mostly from survey panels, not from Amazon. These are the most recent figures we could source, each with its date.
| Measure | Figure | Source |
|---|---|---|
| Gender of Amazon shoppers | 75% women, 24% men, 1% other | Numerator, Mar 2025 |
| Age of shoppers who bought in the last 12 months | Baby Boomers 33%, Gen X 31%, Millennials 27%, Gen Z 8% | Numerator, Mar 2025 |
| Household income of those shoppers | Under $40,000: 22%; $40,000 to $125,000: 48%; over $125,000: 29% | Numerator, Mar 2025 |
| Average age of a U.S. Amazon shopper | 50, up from 37 nine years earlier | CIRP, Feb 2023 |
Sources: Numerator via ConsumerAffairs, Mar 19, 2025 (sample size and method not stated in the article); CIRP, Feb 21, 2023 (500 U.S. adults who bought on Amazon in the prior 90 days, surveyed each quarter). Percentages are rounded and may not total 100.
The 2023 CIRP figure is the newest age average we found, so treat it as dated. We will replace it when a newer one is published.
7. How Many Orders Does Amazon Get?
Amazon does not disclose how many orders it receives. Earlier versions of this page quoted about 12 million orders a day from an aggregator with no primary source; we removed it. What Amazon does report is delivery volume:
- More than 1.5 billion items arrived same-day or overnight in Q3 2026 (Amazon Q3 2026 results).
- Nearly 100 million customers used Same-Day Delivery in 2025, and U.S. same-day items rose nearly 70% year over year (Amazon Q4 2025 results).
- More than 500 million same-day units had shipped in 2026 as of Amazon's 2025 shareholder letter (Amazon 2025 shareholder letter).
- Amazon employed about 1,576,000 people at the end of 2025 (annual filing).
Key Takeaways
- Scale: $797.5 billion in net sales over the 12 months to September 2026, up 15%; 201 million U.S. Prime shoppers (December 2025).
- Marketplace: third-party sellers account for 61% of paid units, and Amazon earned $66.1 billion from seller services and advertising in Q3 2026, equal to 96.6% of its online-store sales.
- Sellers: active sellers on Amazon U.S. fell to about 500,000 and new-seller launches hit a record low, while more than 75,000 sellers passed $1 million in sales.
- Concentration: fewer than 8,000 sellers generate half of U.S. third-party sales value.
- Market share: about 35.7% of U.S. e-commerce (estimate) and 9.6% of all U.S. retail spending.
What This Means for Amazon Sellers
Product choice is the decision you control. stage.analyzer.tools checks a supplier list of thousands of products at once, with profit, ROI and Bought in Past Month. See every data point it returns, or view plans and pricing. Plans start at $15.
More ways to research products: How to Combine Multiple Free Tools for Complete Amazon Market Research.
Share This Graphic
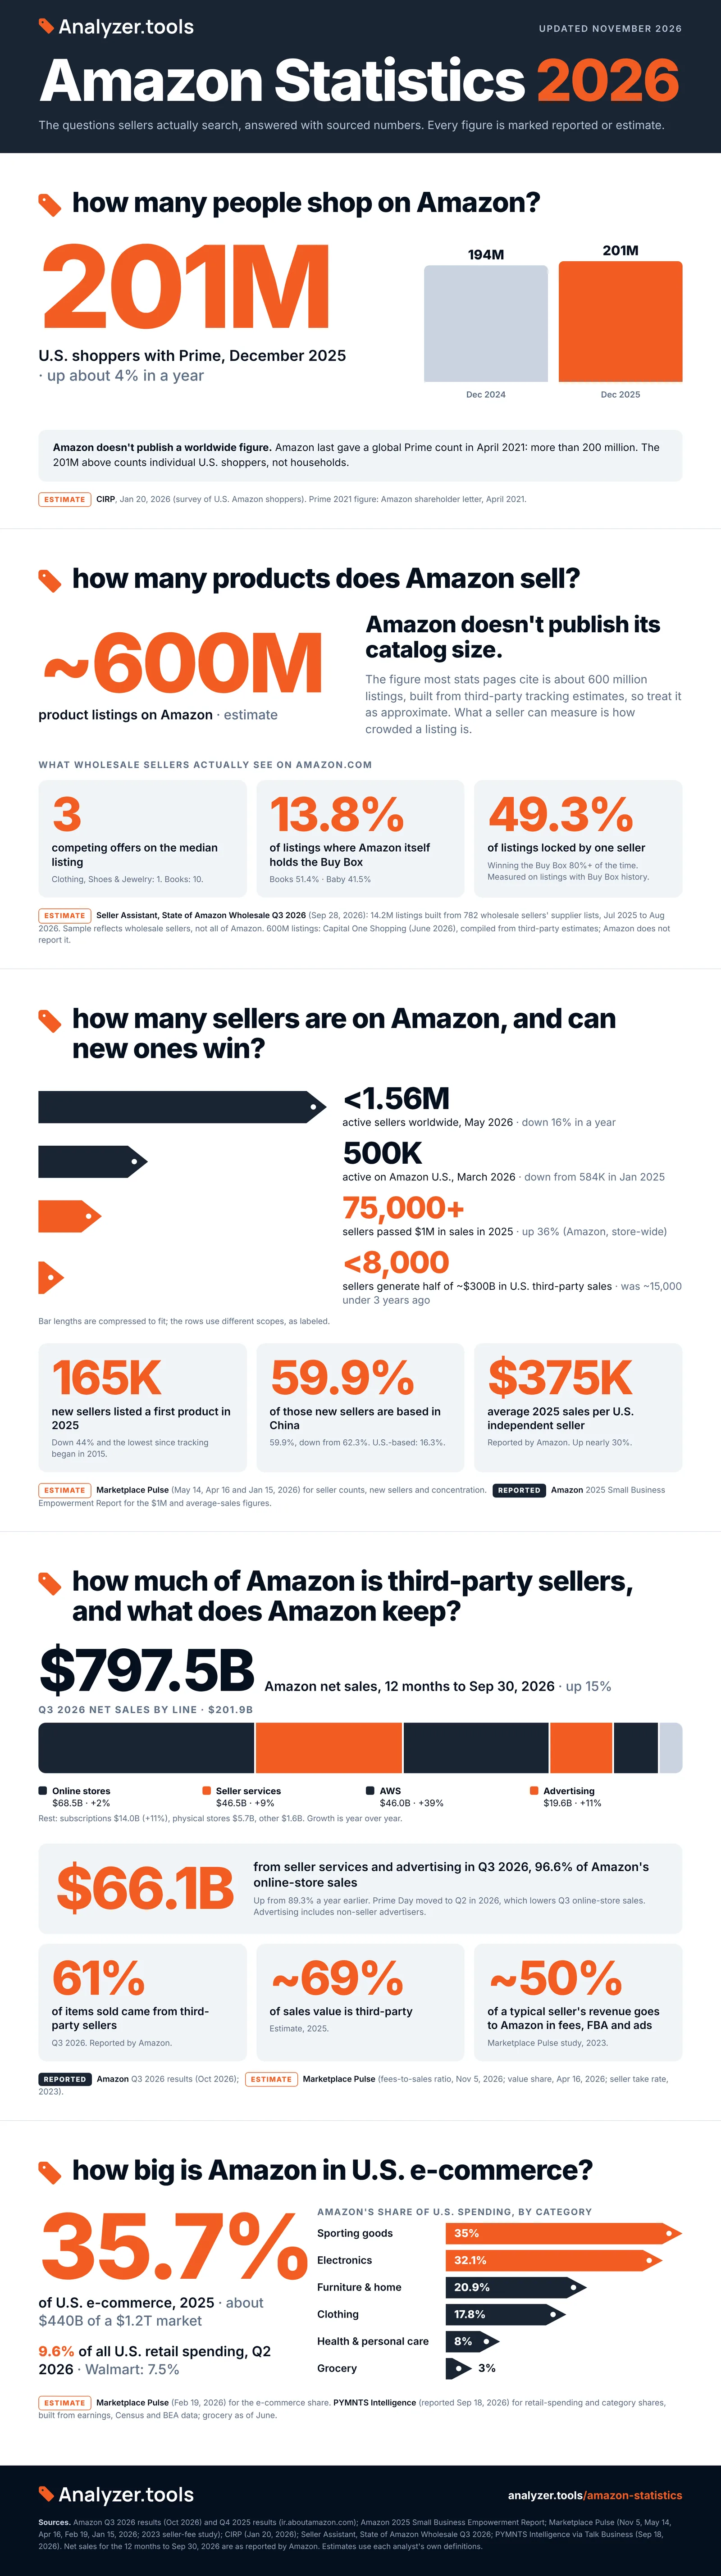
The full infographic is free to use with credit. Use the button to copy the embed code, or right-click the image to save it.
<a href="https://www.stage.analyzer.tools/amazon-statistics/"><img src="https://www.stage.analyzer.tools/wp-content/uploads/2026/11/Amazon-Statistics-2026-infographic.webp" alt="Amazon Statistics 2026 infographic" width="800"></a><br>Source: <a href="https://www.stage.analyzer.tools/amazon-statistics/">stage.analyzer.tools, Amazon Statistics 2026</a>Cite This Page
stage.analyzer.tools. (2026, November 7). Amazon Statistics: A 2026 Look at Users, Sellers, Revenue, and Marketplace Trends. https://www.stage.analyzer.tools/amazon-statistics/
Figures come from Amazon's financial releases, U.S. government data and named analyst firms, each linked where it is used. We update this page after each Amazon earnings release.
References
Note:
Estimates use each analyst's own definitions and methods. Where a source gives no method, we say so in the text.
- Amazon.com, Inc. (2026). Amazon.com Announces Fourth Quarter Results. https://ir.aboutamazon.com/news-release/news-release-details/2026/Amazon-com-Announces-Fourth-Quarter-Results/
- Amazon.com, Inc. (2026). Amazon.com Announces Third Quarter Results. https://ir.aboutamazon.com/news-release/news-release-details/2026/Amazon-com-Announces-Third-Quarter-Results/
- Amazon. (2026). 2025 Small Business Empowerment Report. https://www.aboutamazon.com/news/small-business/amazon-2025-small-business-empowerment-report
- Amazon.com, Inc. (2026). 2025 Shareholder Letter. https://s2.q4cdn.com/299287126/files/doc_financials/2026/ar/2025-Shareholder-Letter-Final.pdf
- Marketplace Pulse. (2026). The Paradoxical Dependence of Amazon & Its Sellers. https://www.marketplacepulse.com/articles/the-paradoxical-dependence-of-amazon-its-sellers
- Marketplace Pulse. (2026). Amazon's Fees and Ads Near Its Retail Sales. https://www.marketplacepulse.com/articles/amazons-fees-and-ads-near-its-retail-sales
- Marketplace Pulse. (2026). Amazon's Least Competitive Marketplace Is Now Everywhere. https://www.marketplacepulse.com/articles/amazons-least-competitive-marketplace-is-now-everywhere
- Marketplace Pulse. (2026). Amazon New Seller Numbers Hit Decade Low in 2025. https://marketplacepulse.com/articles/amazon-seller-registrations-hit-decade-low-in-2025
- Marketplace Pulse. (2026). Amazon and Shopify Are Now Half of U.S. E-Commerce. https://www.marketplacepulse.com/articles/amazon-and-shopify-are-now-half-of-us-e-commerce
- CIRP. (2026). U.S. Amazon Prime Membership Keeps Growing. https://cirpamazon.substack.com/p/us-amazon-prime-membership-keeps
- CIRP. (2023). Amazon Shoppers Older but Not Richer. https://cirpamazon.substack.com/p/amazon-shoppers-older-but-not-richer
- Seller Assistant. (2026). The State of Amazon Wholesale, Q3 2026. https://www.sellerassistant.app/research/state-of-wholesale/2026-q3.md
- Adobe. (2026). 2026 Prime Day Insights. https://business.adobe.com/blog/2026-prime-day-insights
- PYMNTS Intelligence, reported by Talk Business & Politics. (2026). Amazon leads U.S. retail spending share, lags Walmart for grocery share. https://talkbusiness.net/2026/09/amazon-leads-u-s-retail-spending-share-lags-walmart-for-grocery-share/
- U.S. Census Bureau. (2026). Quarterly Retail E-Commerce Sales, 2nd Quarter 2026. https://www.census.gov/retail/ecommerce.html
- Numerator, reported by ConsumerAffairs. (2025). Amazon scores with women, who make up 75% of its customers. https://www.consumeraffairs.com/news/amazon-scores-with-women-who-make-up-75-of-its-customers-031925.html
- Capital One Shopping. (2026). How Many Products Are on Amazon? https://capitaloneshopping.com/research/number-of-products-on-amazon/